Val Nav 2023 Release
We are thrilled to announce the release of Val Nav 2023! From capital cost lookups to a brand-new technical comparison to daily-resolution forecast results, your company’s asset model will be more efficient, insightful, and trusted than ever before. Check out each of the most exciting features coming in this milestone release:
Capital Cost Lookups
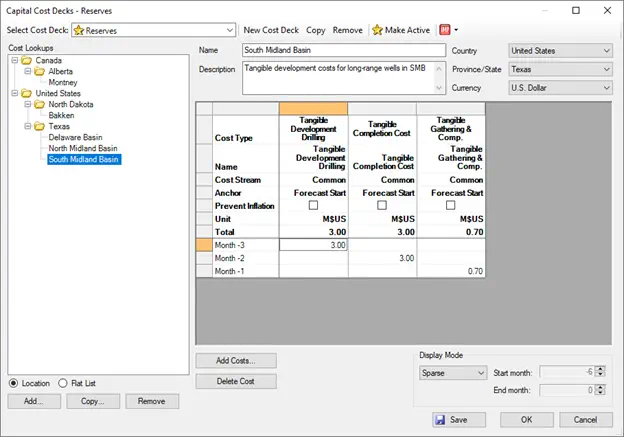
Economic modeling leaps forward in Val Nav 2023 with a new method to model capital costs. Now, capital costs can be genericized as models that are assigned for wells to reference.
Sharing the same structure as price decks, updating the capital cost lookups automatically update all wells that use them. Sensitivities can be created just by running different capital cost decks without any change to the wells.
Even better, lookups are built relative to an anchor date on the well so capital costs are scheduled dynamically. As each well's schedule evolves, Val Nav updates the capital based on the updated anchor date requiring no extra updates from the user.
Capital decks will also be subject to separate security permissions. Altogether this means that capital modeling will be more efficient, trusted, and connected than ever before.
Technical Comparison Tab
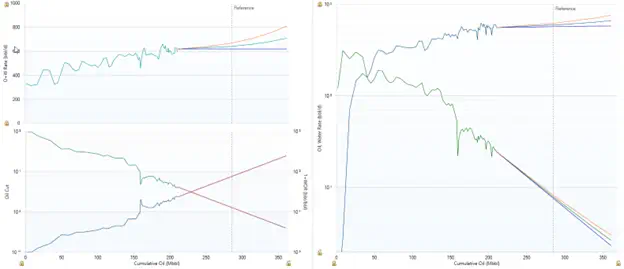
The technical comparison tab has been overhauled to offer an outstanding new forecast visualization and comparison experience. From lookbacks to reserves maturation to cross-department comparison, the reinvigorated tab offers comprehensive comparison for every forecast your company generates:
- Quick modes to compare across archives, plans, and reserves categories.
- On-demand rollup and multi-well comparison simply from hierarchy selection.
- Project-defined coloring for consistency & management-grade presentations.
- Graph translation layer to use your own custom graphs for comparison.
- Modernized UI, data tables, data point tracking, and more!
Daily Forecasts
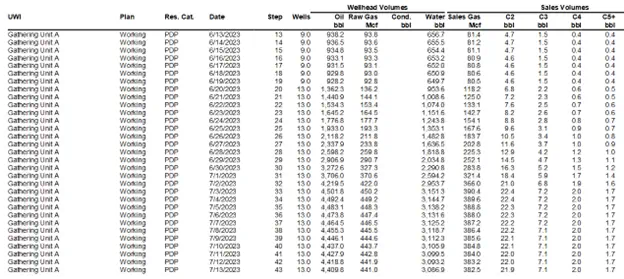
Val Nav can now generate true daily forecast results with a new release plug-in that leverages Val Nav’s daily decline engine. When installed, a new "Daily Forecast Report" is available that can generate daily results across a specified date range or duration from the forecast start. It can also optionally aggregate or expand child forecasts when run on a folder level. The daily results combined with the flexibility of the report facilitate a variety of use cases:
- Understand the impact of high-rate wells or pads coming online against facility constraints.
- Provide more accurate daily projections for pipeline commitments or monthly outlooks.
- Export results to CSV for presentation or analysis.
Re-forecasting Re-imagined
Val Nav 2023 also adds thoughtful improvements to the re-forecasting effort engineers tackle so often throughout the year:
- New intuitive axis dragging on the decline tab allows engineers to easily scale graphs.
- Graph-based fits have been re-imagined placing engineers in a multi-product workflow. Once the first product is fit, the user can evaluate the result and hit the tab key to cycle to the next product or ratio defined on the graph.
- Fit options have been expanded to allow the user to control rate matching done during fitting routines including options to always match the last historical rate, ignore the latest rate in favor of the established trend, or use Val Nav's proprietary calculated rate matching.
Forecast by Exception Workflow
The Forecast Variance plug-in created a powerful workflow to focus re-forecasting efforts on the wells whose forecasts deviated most from new production history import. By calculating the variance between history and forecast, binning the result, and writing it to a custom field, wells could be organized by their deviation from history in the user's hierarchy.
Val Nav 2023 brings the plug-in into the application and elevates its functionality with project-level options to control the duration of overlap used and products to run on. Now, users can simply update variances directly from the Forecasts menu and focus on re-forecasting the most deviated wells.
Last Year for Economic Monthly Output
The “Last year for economic monthly output” setting has been moved from the project level to the scenario level. The number of years to store monthly data directly affects economic calculation times due to the greater volume of data to persist. Now, users can customize their scenarios to run faster and store less data than the global setting.
And much more...
As always, we’ve added many more important enhancements and bug fixes, as well. Please visit the help file for the full release notes. Here is a sample of a few of the other enhancements:
- Faster hierarchy navigation via keyboard shortcuts.
- Improved Data View navigation with filter and search.
- Incorporated our most popular plug-ins into the main application for simpler IT deployment.
- Keyboard shortcut to flag wells.
 Previous Page